
|
Getting your Trinity Audio player ready...
|
By Winnie Kamau
Nairobi, Kenya: During the 3rd Global Data Festival in Nairobi, Governor Dr. Wilbur Otichillo showcased Vihiga County’s pioneering approach to evidence-based governance. By leveraging the Vihiga Data Center and satellite imagery to map health services and infrastructure, the county has successfully utilized data to address complex political hurdles.
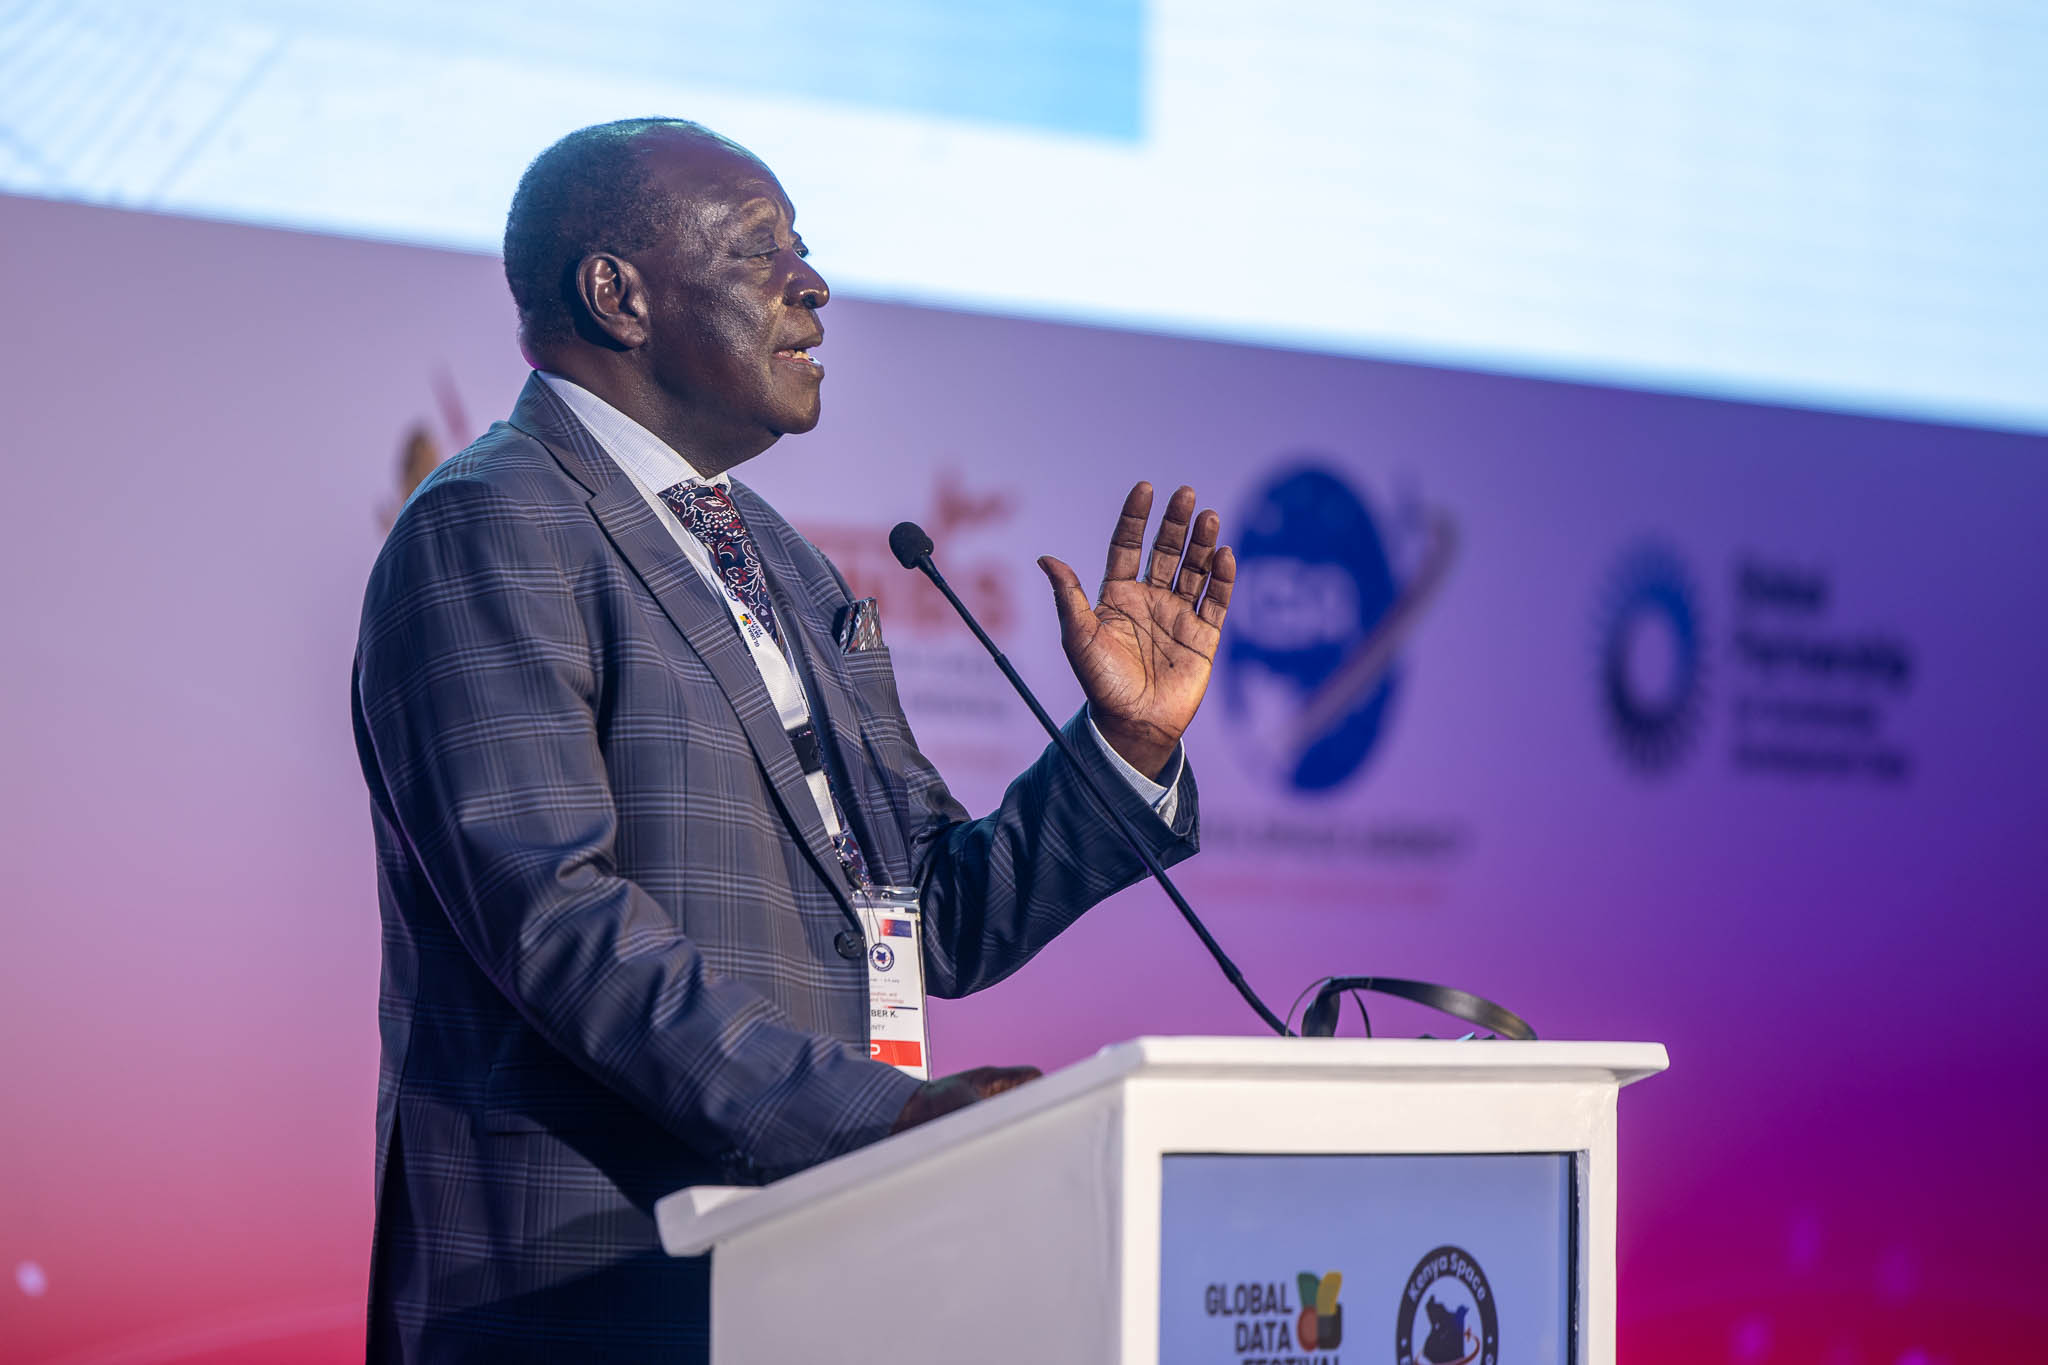
Speaking as the event’s Key Guest Speaker, Dr. Otichillo, Governor of Kenya’s Vihiga County, addressed an audience of over 1,000 delegates from 95 countries, including major figures from global statistical and space agencies.
When Dr. Wilbur Otichillo was elected Governor of Vihiga County in western Kenya in 2017, he inherited something every politician inherits: a long list of promises made to constituents, a limited budget, and an urgent need to make decisions that would affect real lives.
He also inherited something most politicians overlook entirely: a question about method.
“Normally in this country, and I guess elsewhere, when politicians get elected, they promise many things,” he told delegates at the 3rd Global Data Festival in Nairobi. “And when they come on the ground, it becomes necessary that they have to make decisions. Most decisions are made arbitrarily.”
But Dr. Otichillo, a geographer, academic, and scientist before he was a politician, decided he would not govern that way. What happened next offers one of the most compelling case studies in evidence-based governance Africa has produced.
 The Map That Changed Everything
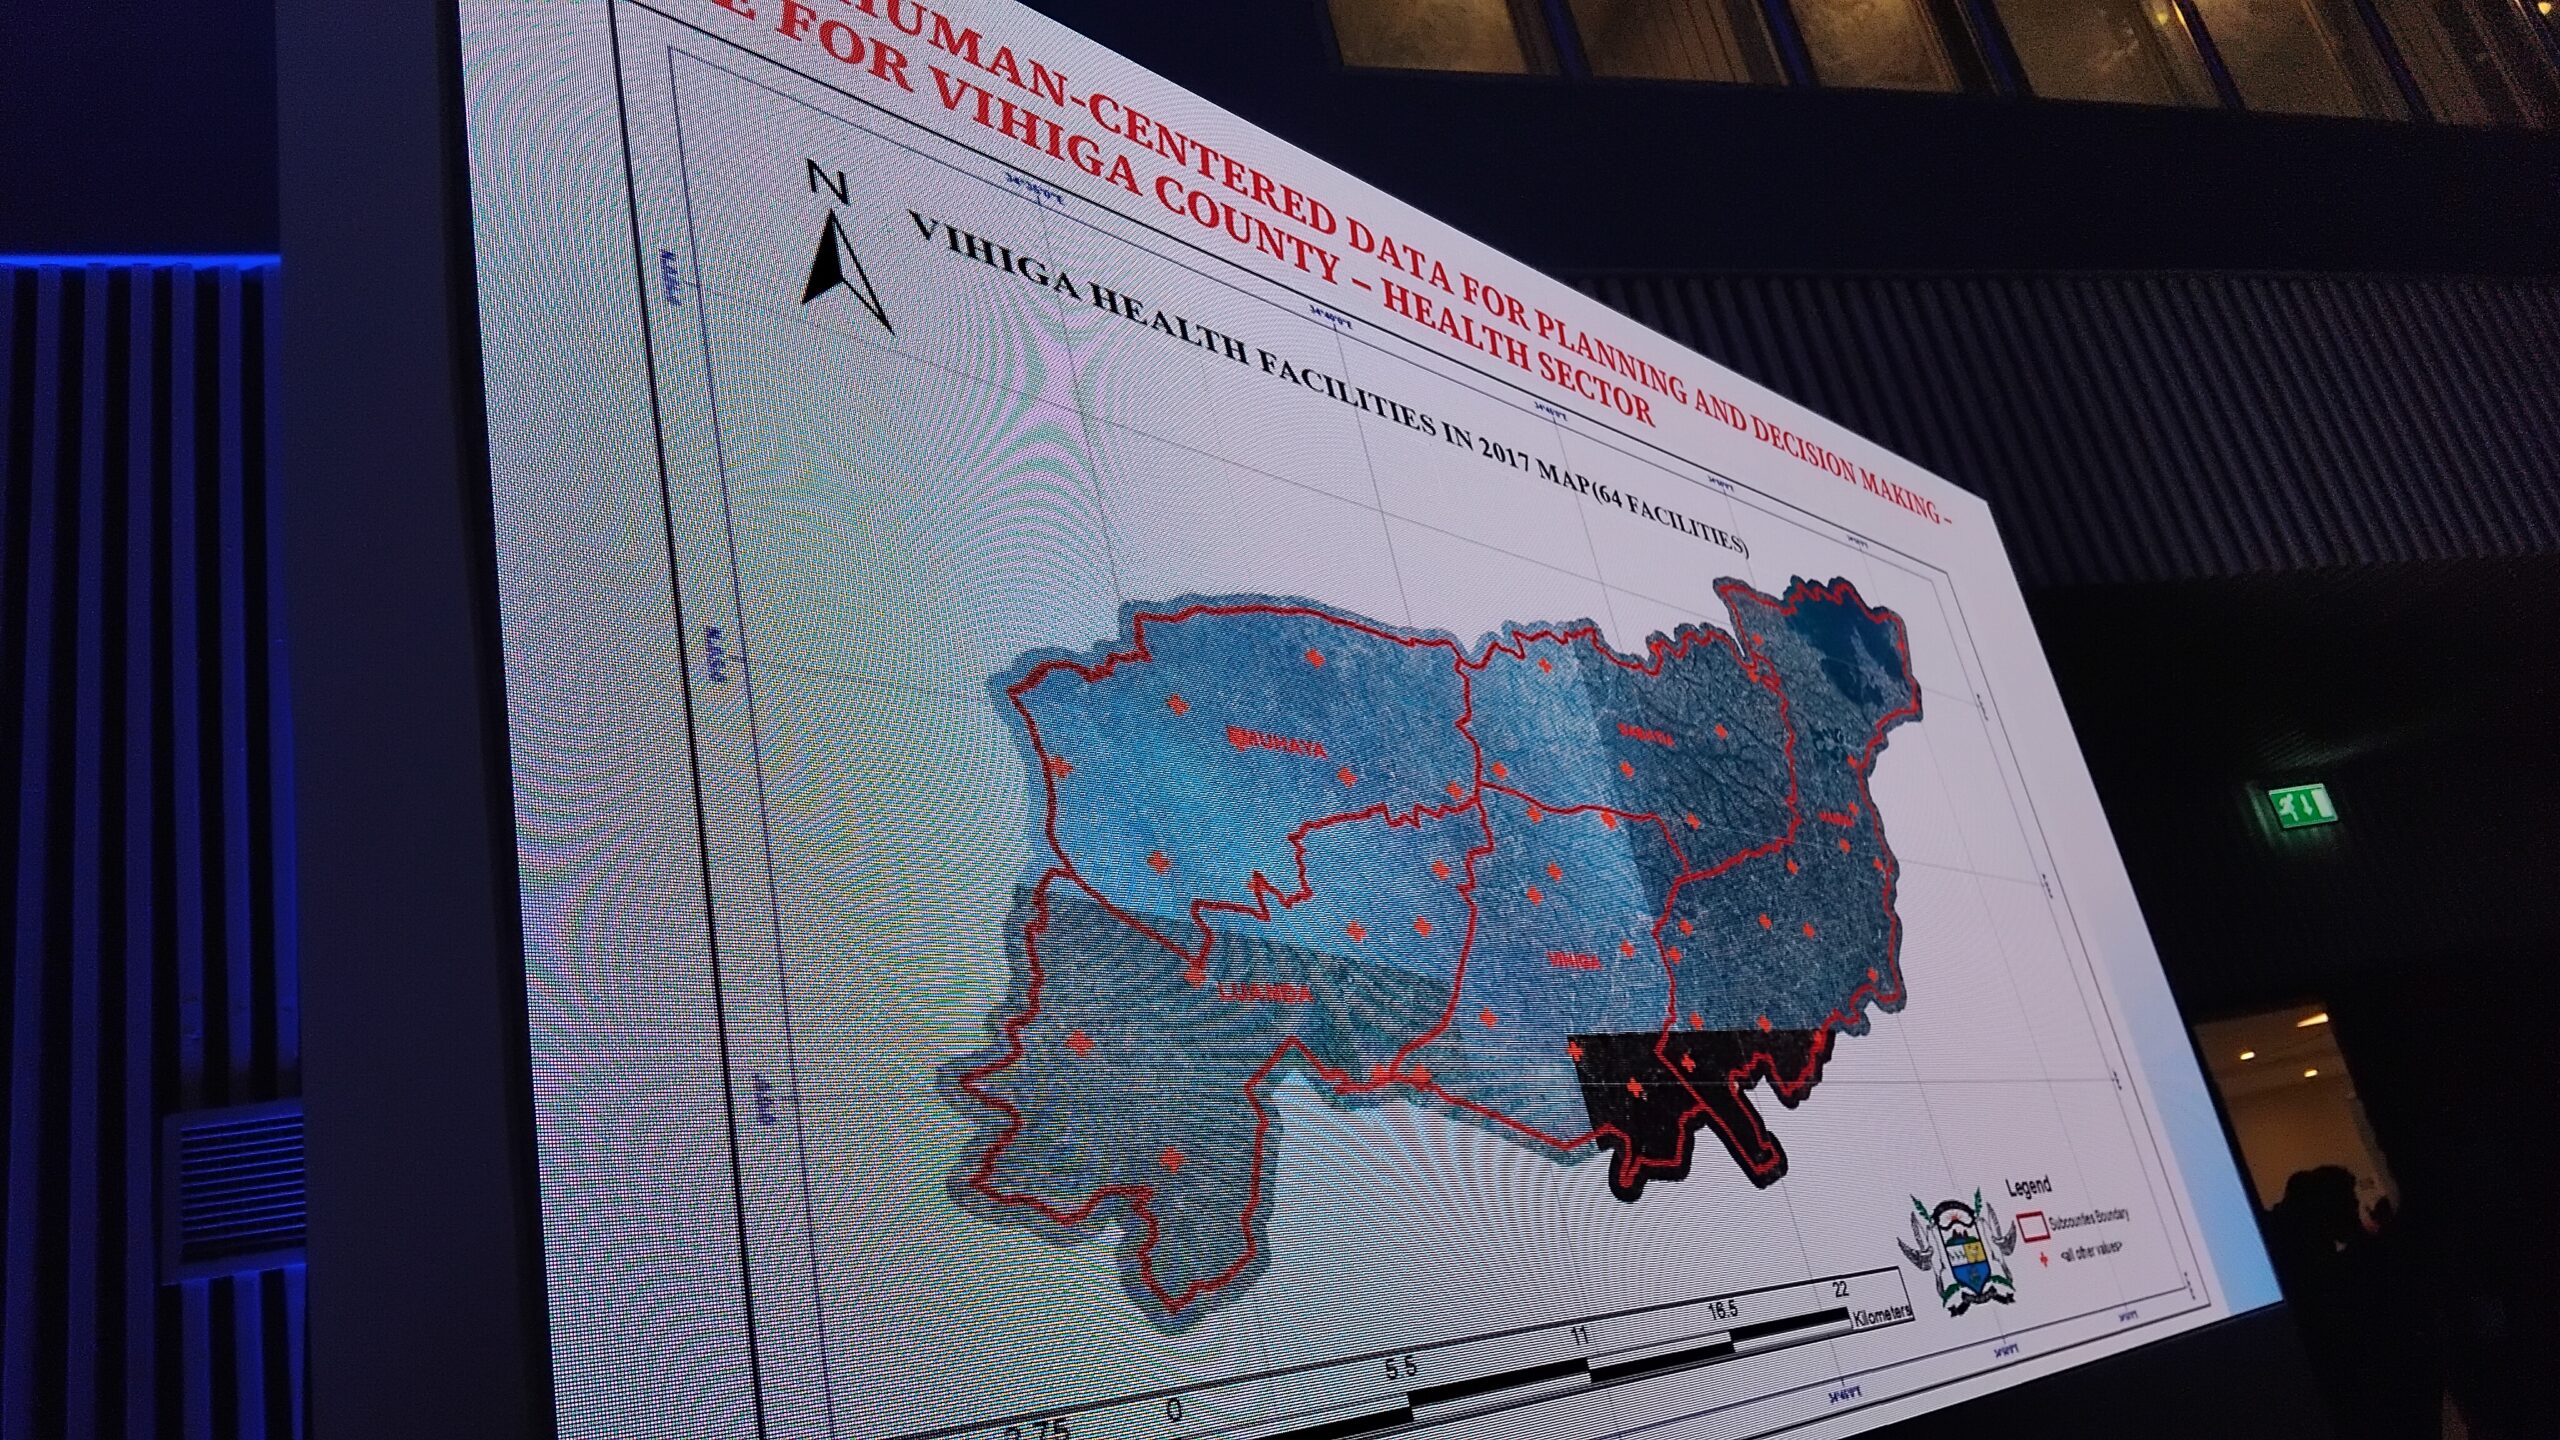
Vihiga County had 64 health facilities when he took office. On paper, that sounded reasonable. But the distribution of those facilities had been shaped over years by political negotiation, constituency loyalty, and the kind of informal deal-making that determines where public investment lands in communities across the continent.
The result, as a map revealed clearly, was a patchwork of areas dense with facilities, others with large gaps where residents had to travel far for care. The politically obvious solution was to let each elected official designate where new facilities should go in their ward. That is how it has always been done.
Dr. Otichillo chose a different path
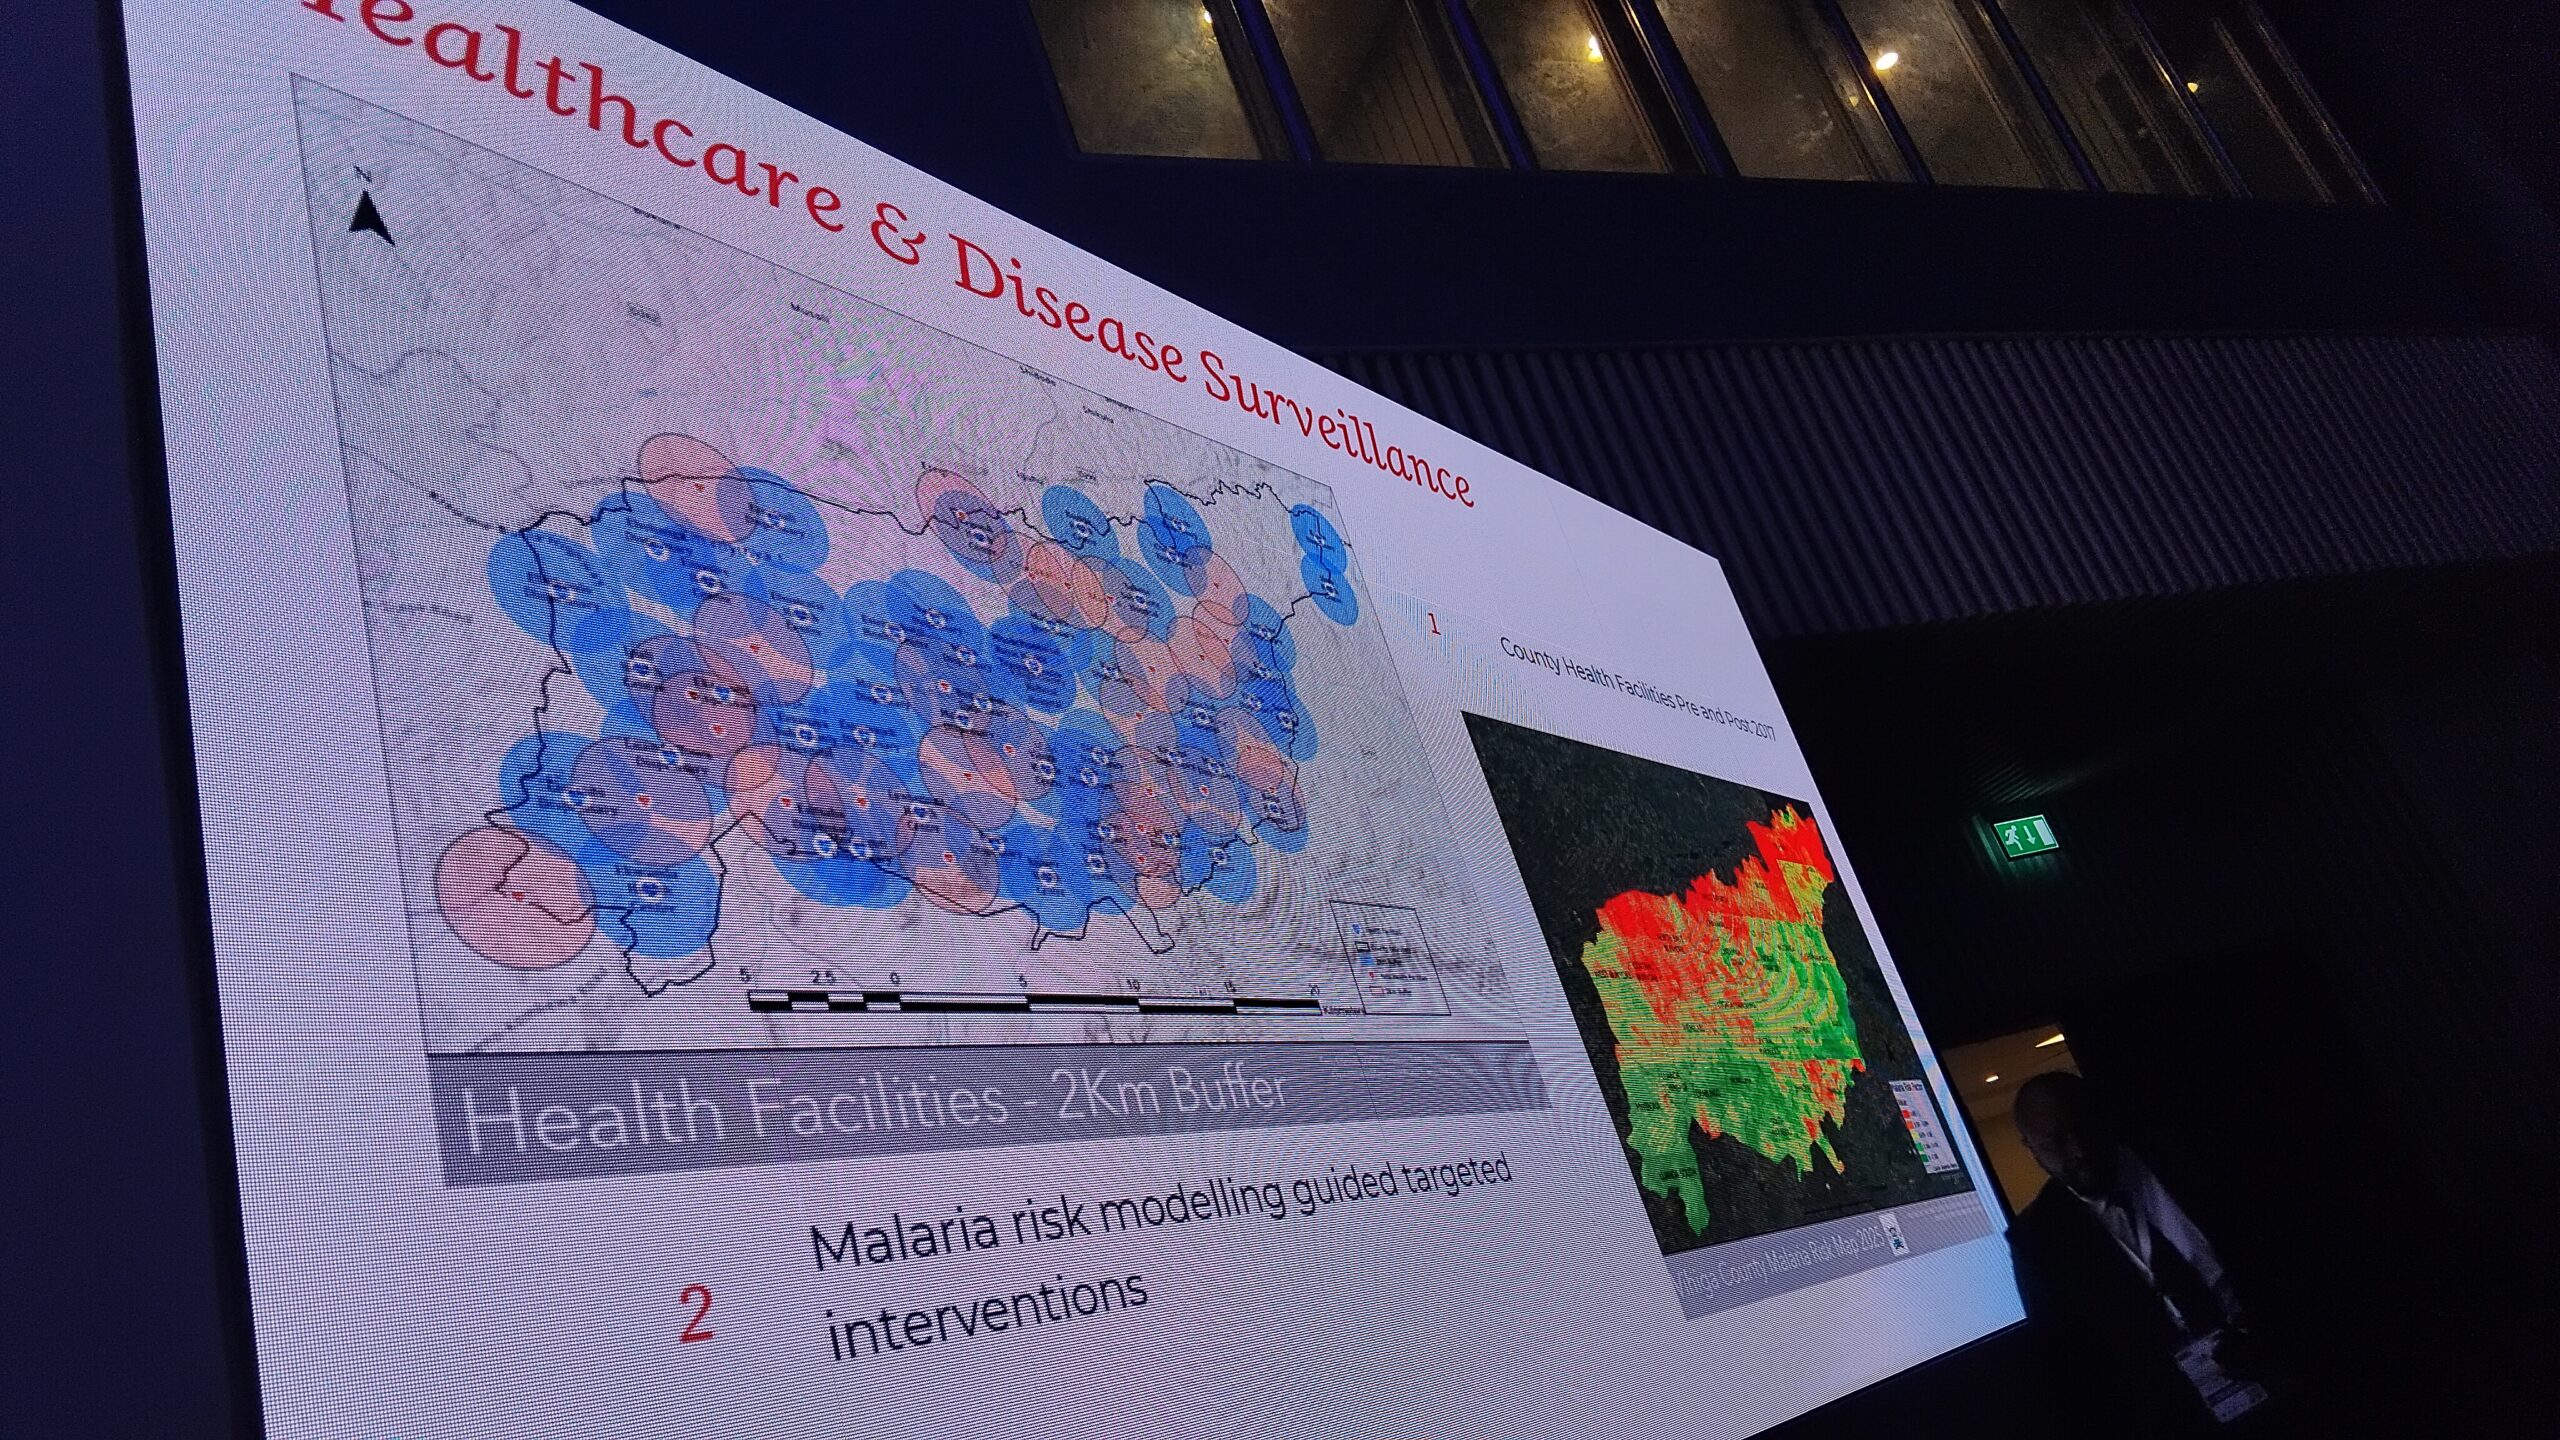
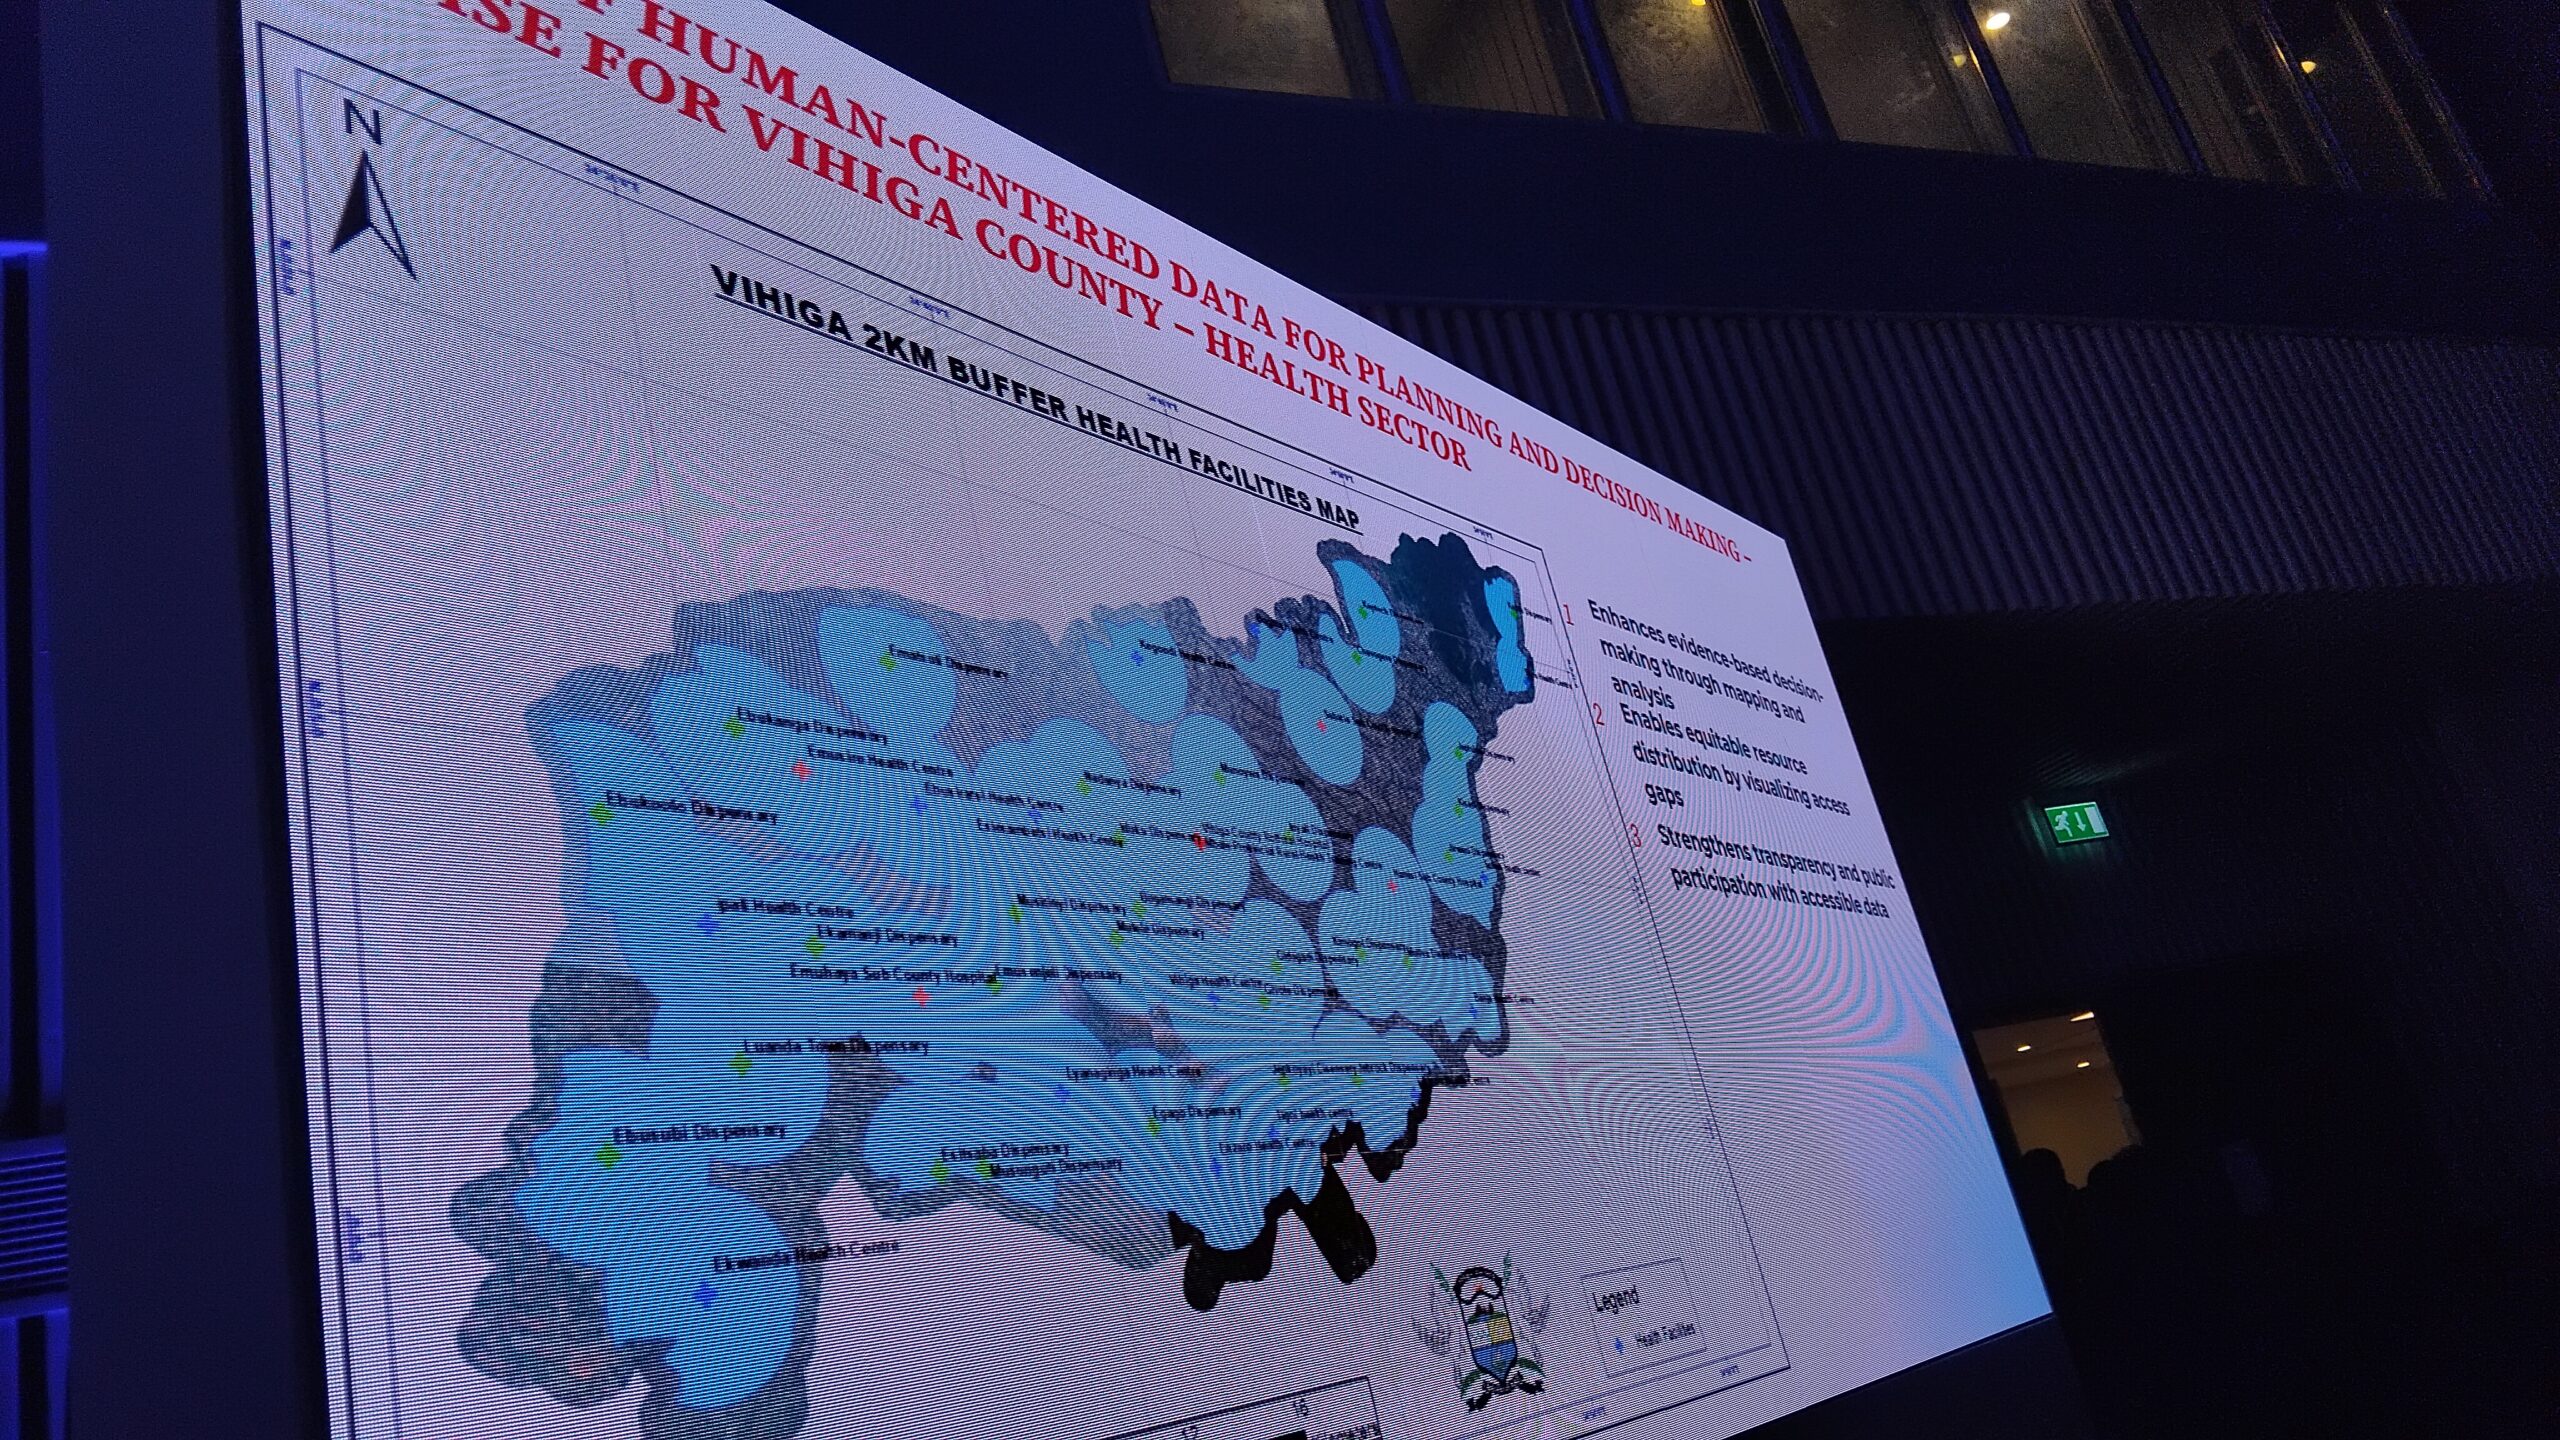
Using Geographic Information System (GIS) technology, his administration ran a buffering analysis, a spatial calculation that maps the area reachable within a set distance from any given point. The county set a clear, non-negotiable standard: no resident of Vihiga should have to walk more than two kilometres to reach a health facility.
“We did buffering, and we found out where the gaps were,” he said. “After we found out the gaps, we were able to identify areas where we have to put new facilities.”
The new facilities were placed where the data said they were needed, not where the politicians said they were wanted. The blue dots on the updated map told the story. And when elected representatives pushed back, demanding facilities in their own strongholds, the county had something unusual on its side: an unarguable, evidence-based answer.
“Initially, we had a lot of issues with the politicians because each one of them wanted a facility in his or her place,” he recalled. “But with this, we were able to convince.”
That sentence is so plain, so quiet and may be the most powerful thing said at the entire festival.
Beyond Health: A County Run on Evidence
The health facilities story was just the beginning. Having established that data could win arguments that politics could not, Dr. Otichillo’s administration systematically extended the approach across every sector of county government.
 In public health, the county used disease surveillance data to map areas with the highest malaria incidence and used that map to direct drug distribution precisely where it was needed, rather than spreading medicines evenly across the county regardless of burden.
“When it comes to drugs, we know where to distribute them,” he said, “and not just give them across the board.”
In the environment, the county began monitoring forest degradation using Sentinel satellite imagery part of the European Space Agency’s earth observation programme. The data revealed what was being lost. It also guided what was being restored.
Looking at temperature and vegetation data across years, the improvement was measurable. Forests that had shrunk have grown back. The NDVI, a satellite-derived index of vegetation health showed the change in vivid, verifiable colour.
“In 2014, most of that area of our county was very fair in terms of vegetation,” he explained. “But through restoration, you can see the vegetation has improved drastically.”
 In urban planning, GIS replaced guesswork entirely. Settlement plans, infrastructure maps, land-use zoning all produced using GPS, remote sensing, and spatial analysis. In an area home to a growing university town and new urban centre, the county could now plan for growth rather than react to it.
Across all sectors, dashboards were built accessible online, visible to decision-makers and citizens alike. Public participation, a legal requirement in Kenya’s devolved governance system, was transformed from a procedural obligation into a genuine exchange of evidence. Communities could see the data that shaped decisions about their lives.
A System Built to Last
What makes Vihiga’s story more than an inspiring anecdote is that it is not unique. Dr. Otichillo was able to stand before a global audience and confirm that all 47 of Kenya’s county governments have now fully established GIS database systems.
The legal foundation is there Kenya’s County Government Act requires counties to establish databases for planning purposes and to link up with the Kenya National Bureau of Statistics. The technical capacity is being built county by county, data centre by data centre.
“We have data from the national government, data inputs from so many sources, legal frameworks, the system itself, and then the county integrated development plan which we use to make decisions,” he explained.
“Raw data alone cannot give you much. You need data to be analysed, organised, given meaning. Then further analysis gives you knowledge. And finally, you can make insights” he explained.
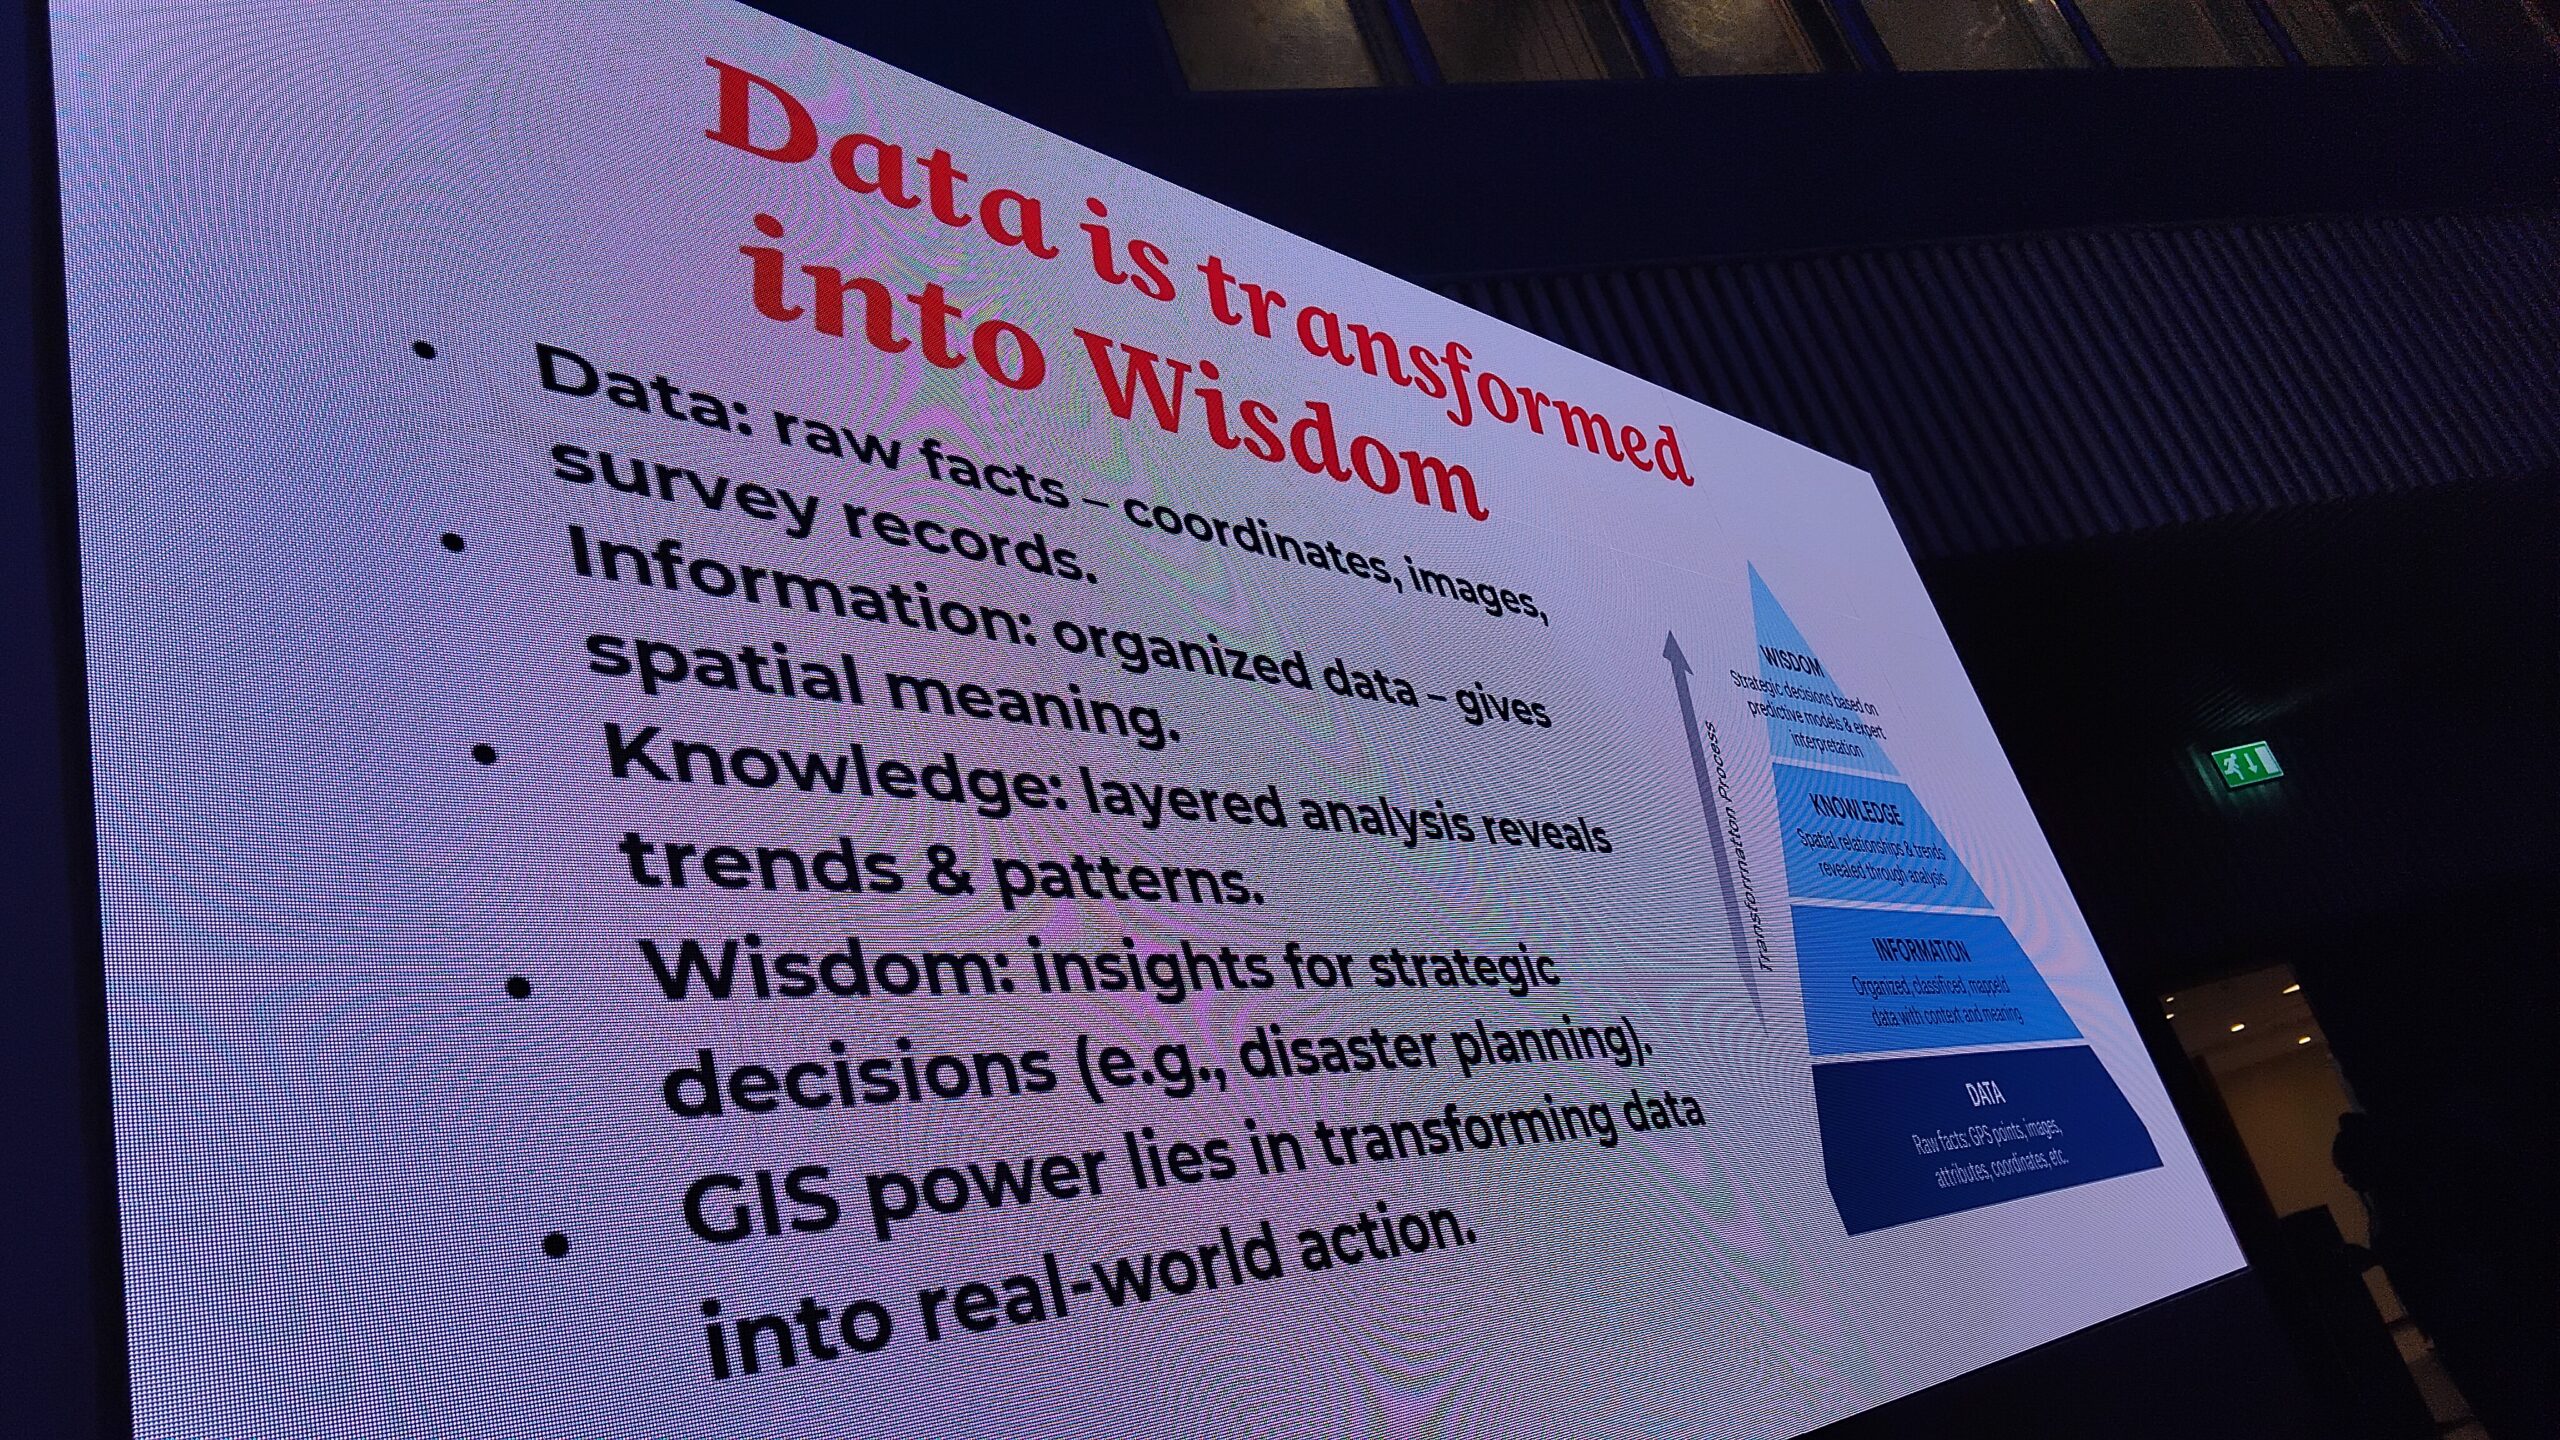 It is a process any scientist would recognise: raw material refined into understanding, understanding refined into action.
The model he described is not glamorous. It requires training staff, building systems, maintaining infrastructure, enforcing standards, and perhaps most difficult of all persuading politicians to accept conclusions they did not choose. But it works.
“GIS and earth observation is transforming governance in Vihiga and in all our 47 counties,” he said. “This ensures transparency, efficiency, and equity in service delivery. Whatever we do planning, budgeting, monitoring and evaluation — we must give evidence.”
What Vihiga Proves
The story of Vihiga County is, at its core, a story about trust. Trust that evidence is stronger than politics. Trust that communities deserve to understand the decisions made on their behalf. Trust that a county government, even a small one in western Kenya can build the systems needed to govern well.
It is also a story about what happens when a scientist becomes a governor and refuses to leave his methodology at the door.
“I want to say that I’m very happy I’m back at home,” Dr. Otichillo told the Nairobi audience, with a warmth that drew laughter. “At least I know I’m with the people we can reason with.”
In a world of overlapping crises, where data systems are too often treated as optional extras rather than the backbone of good governance, Vihiga County offers a different proposition. Count everything. Map the gaps. Place the resources where the evidence says they belong. And when the politicians object, show them the map.


